I want to represent the logic of my program through a diagram, since the program is pretty complex; I need a way to explain to another person, why and how something happens in my program. Is flowchart the only option?
+1
A:
If you need to explain things at a step-by-step level, yeah a flowchart is really what you need. If you can speak at a higher level another option may be state diagram.
Branden Hall
2009-08-30 16:30:04
+3
A:
Flow charts are a popular choice, and often suited for non-technical people.
If you're interested in providing a more technical view of the situation, UML may be a better choice.
A sequence diagram shows how components interact with one another.
bryanbcook
2009-08-30 16:32:21
There are also use case diagrams. But based on the question, I agree - flowcharts would be my first choice.
TrueWill
2009-08-30 16:39:37
+2
A:
In UML, different diagrams are intended for different things, using different methodologies. Considering we tend to lean to the Object Oriented Methodologies, I will explain the different diagrams and how they work.
Use Case Diagram - The point of use case models is to identify and define all of the elementary business processes that the system must support. This is from both a user and a system point of view. Any single action within your system can be used in a use case, which then will allow further more explanatory models to be used.
Activity Diagram - This is a type of workflow diagram used for describing what goes on in a use case diagram. It is basically a visual method to describe the flow of an activity, or multiple activities.
Sequence Diagram - This is a diagram to show communication between different objects in a system, or a process. Sequence diagrams are important in analysis, as they become crucial for detailed system design and user interface design. I really like these as they give a fantastic view of what is happening in the system.
State Machine Diagram - This allows you to track the states of objects throughout their lifetime, which gives great insight into how objects are meant to work. This gives the ability on how to map events and the like effectively in the system.
Using the above mentioned diagrams gives a great basis for analysis and design, and one should note that once these diagrams are created, they are not necessarily complete. In design processes, you will alter these diagrams as the system evolves. I hope this helps you. Below are links to wikipedia for the different diagrams mentioned.
Kyle Rozendo
2009-08-30 17:02:04
A:
Behind every program is a problem domain, in which presumably a set of problems that are well understood by a group of domain-knowledgeable people, and a solution domain, in which methods for solving such problems are collected and used to handle the problems.
To explain something, you have to first agree on the problem domain. If your problem domain is signal processing, and the explanation is going to somebody who is unfamiliar with the domain, you're already toast.
Then you need to explain the solution domain (or refer a well known set of solutions as one might find in an engineering handbook), so that you can justify a particular choice of solution that is well suited for this particular problem and other constraints that may be placed on the answer (runs in small machine, can be built in a day, etc.). If the person you are explaining things to doesn't understand a Fast Fourier Transformation as a possible solution to a problem in your chosen domain of signal processing, you're not going be able to expalin the solution let alone that is the best of your choices.
Once you pass these two obstacles, then maybe a flowchart might be helful. Other crutches such as various types of UML diagrams are all about explaining structure of the solution from various perspectives. Which perspective matters depends on what the purpose of the explanation is.
Regarding flowcharts: while they were popular once, for describing algorithms, psuedo code is generally good enough. People that can't follow psuedo code are not likely to follow a big flow chart either. And if your flowchart is trivial, you don't need it. I haven't used one seriously in 20 years. Most of the computer science literature doesn't seem to use it either.
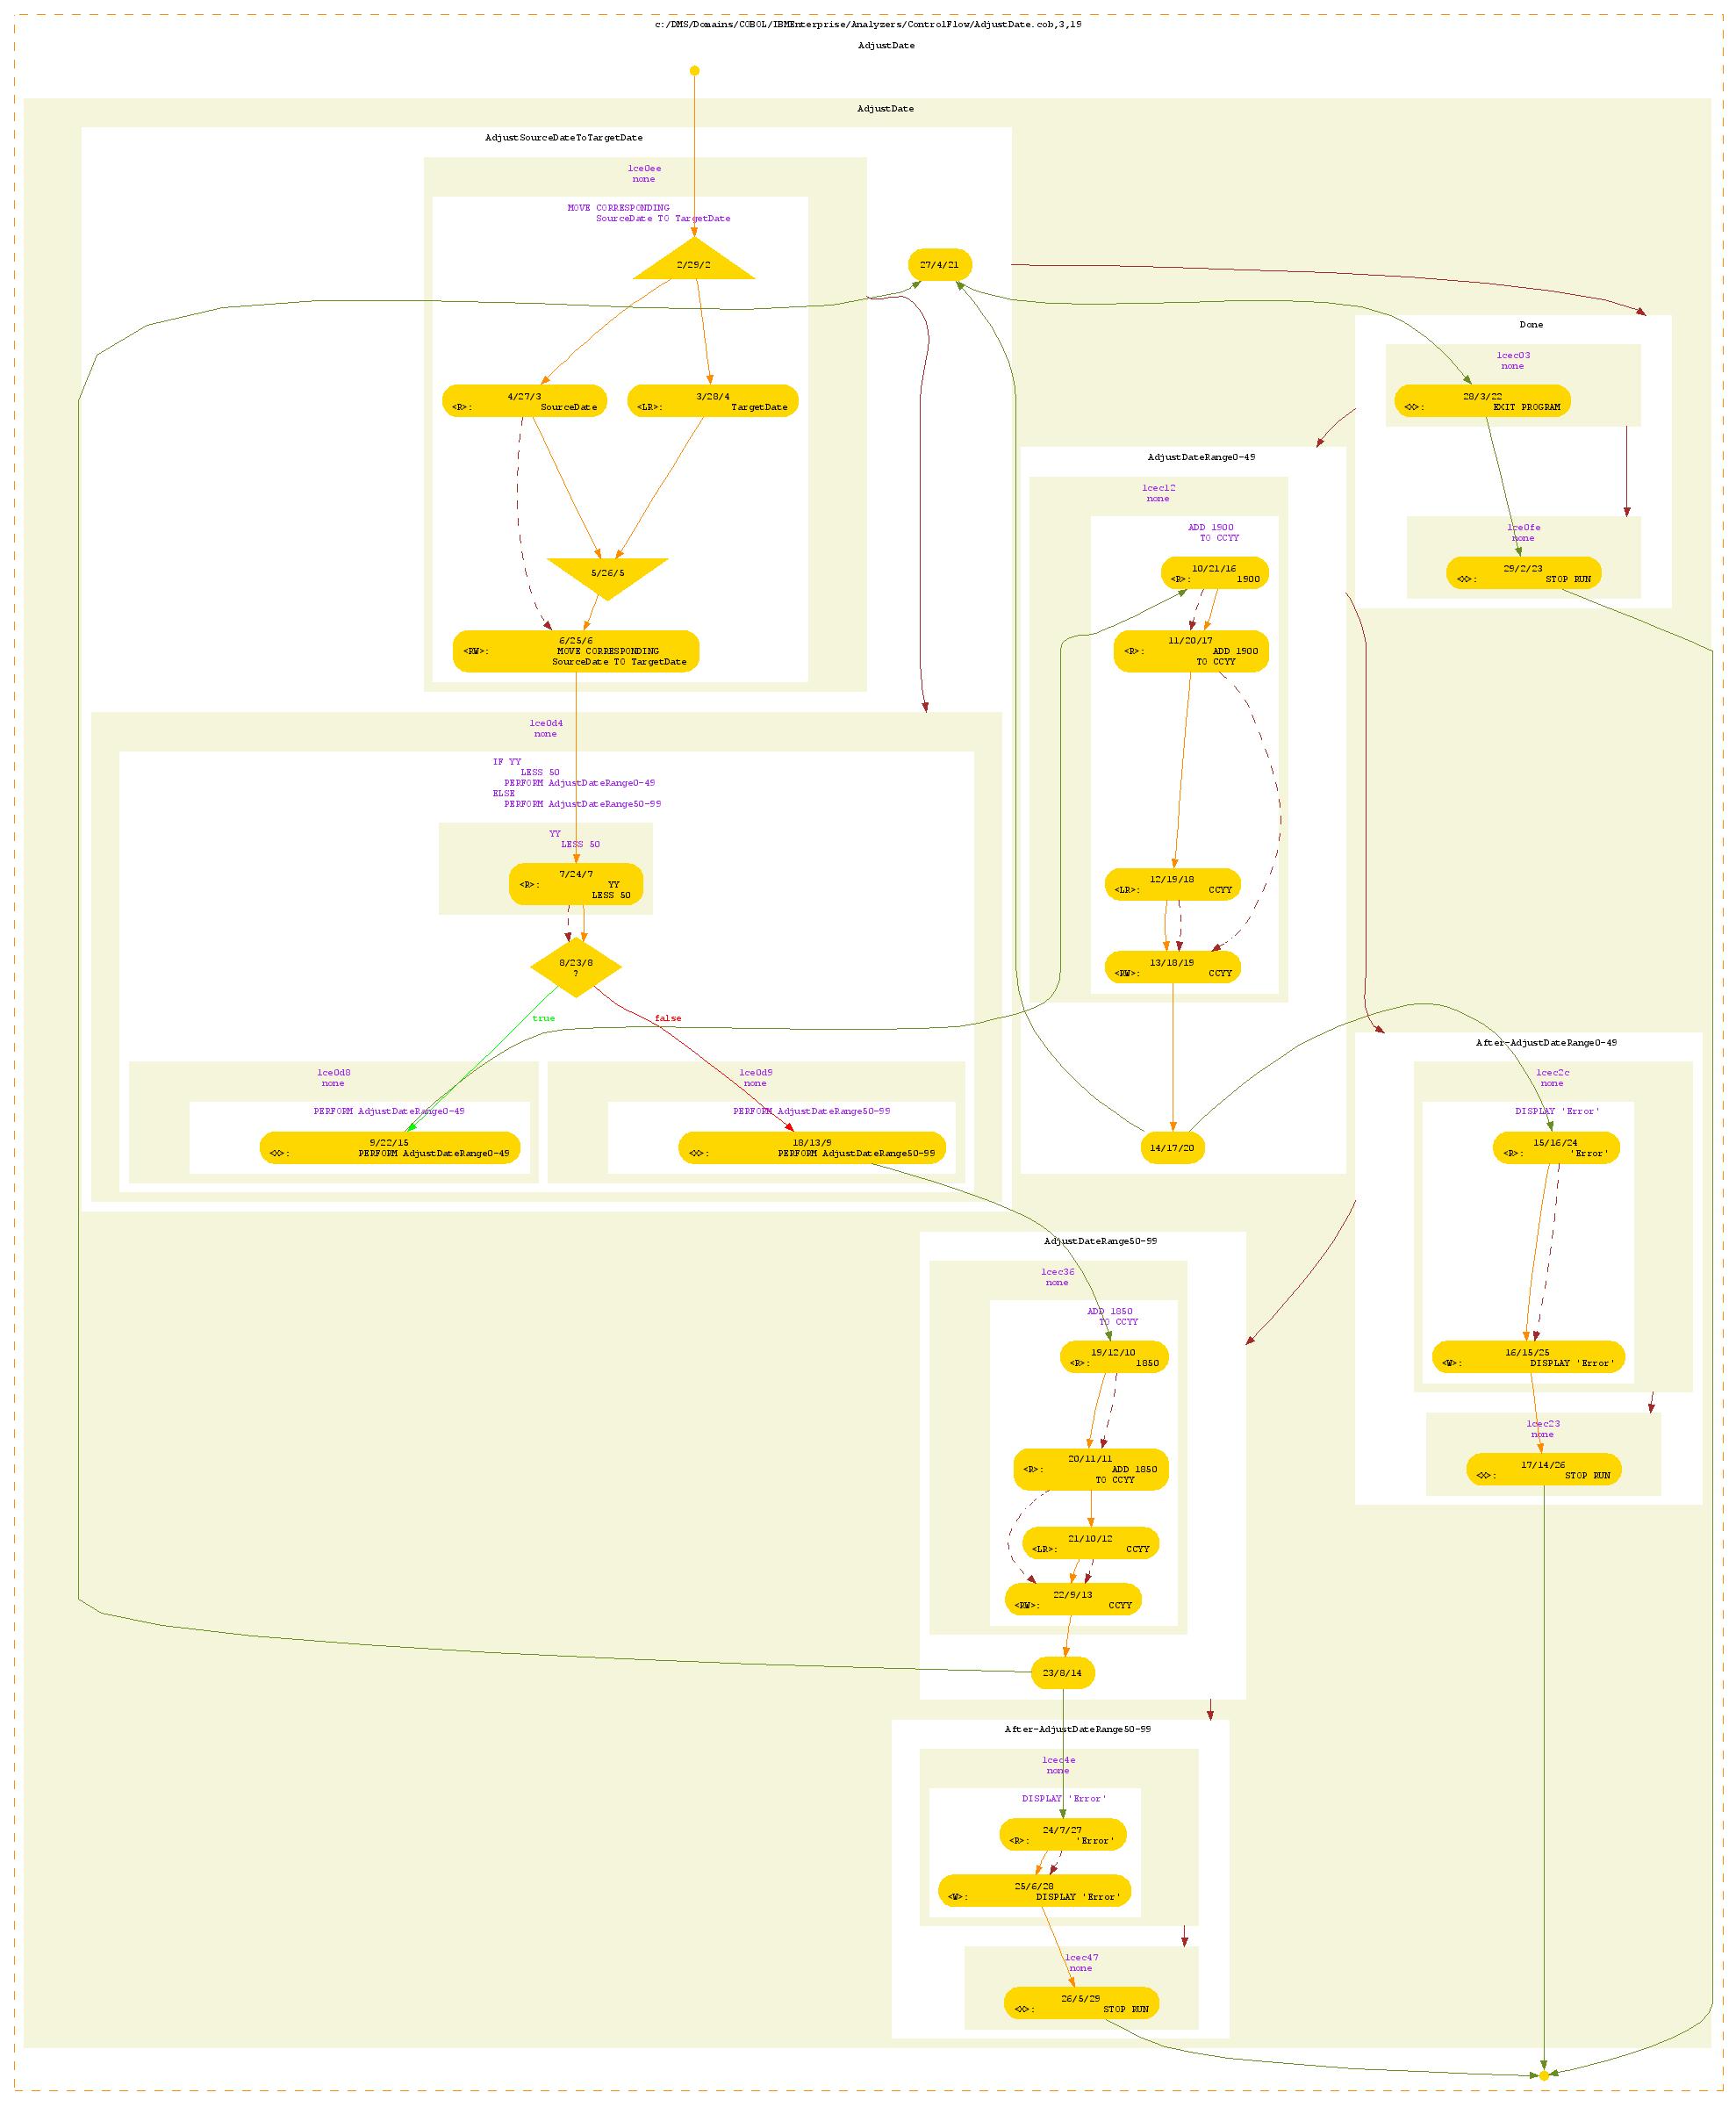
Having said this, when one wants to understand in extremely fine detail what an actual piece of code is doing, especially for the purposes of automated program analysis, flowcharts (under the fancier name "control flow") are still pretty useful. See a COBOL control flow graph (and see this for an explanation). It should be obvious you don't want to use this to explain an algorithm to another person.
Ira Baxter
2009-08-30 17:20:10