Yes, you can use spines for this.
import matplotlib.pyplot as plt
from matplotlib.ticker import MultipleLocator, FormatStrFormatter
import numpy as np
fig = plt.figure(1)
ax = fig.add_subplot(111)
# set up axis
ax.spines['left'].set_position('zero')
ax.spines['right'].set_color('none')
ax.spines['bottom'].set_position('zero')
ax.spines['top'].set_color('none')
ax.xaxis.set_ticks_position('bottom')
ax.yaxis.set_ticks_position('left')
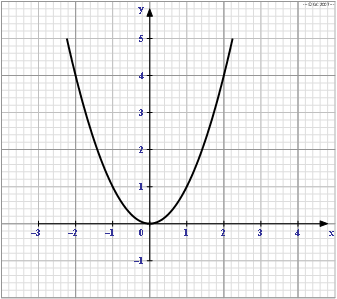
# draw curve
x = np.arange(-2.5,2.5,0.01)
line, = ax.plot(x, x**2)
#set bounds
ax.set_ybound(-1,7)
# create grid
#ax.xaxis.set_major_locator(MultipleLocator(1))
#ax.xaxis.set_minor_locator(MultipleLocator(0.2))
#ax.yaxis.set_major_locator(MultipleLocator(1))
#ax.yaxis.set_minor_locator(MultipleLocator(0.2))
#ax.xaxis.grid(True,'minor')
#ax.yaxis.grid(True,'minor')
#ax.xaxis.grid(True,'major',linewidth=2)
#ax.yaxis.grid(True,'major',linewidth=2)
#adjust grid on the 2s
#for idx,loc in enumerate(ax.xaxis.get_majorticklocs()):
#if loc !=0 and loc % 2 == 0: ax.get_xgridlines()[idx].set_c('r')
#for idx,loc in enumerate(ax.yaxis.get_majorticklocs()):
#if loc !=0 and loc % 2 == 0: ax.get_ygridlines()[idx].set_c('r')
## THIS IS THE EDIT
ax.xaxis.set_minor_locator(MultipleLocator(0.2))
ax.yaxis.set_minor_locator(MultipleLocator(0.2))
ax.xaxis.grid(True,'minor',linewidth=2)
ax.yaxis.grid(True,'minor',linewidth=2)
minor_grid_lines = [tick.gridline for tick in ax.xaxis.get_minor_ticks()]
for idx,loc in enumerate(ax.xaxis.get_minorticklocs()):
if loc % 2.0 == 0: minor_grid_lines[idx].set_c('r' )
elif loc % 1.0 == 0: minor_grid_lines[idx].set_c('g' )
else: minor_grid_lines[idx].set_c( 'b' )
plt.show()