views:

266

answers:

4

alt text

The unit of x-axis is hours (h), and there are 24 hours in total.

The unit of y-axis is millions (m).

How do I calculate the area under the red curve in the image in units of m*h?

Important UPDATE

Only the image is readily available (not the data), and I want to calculate the area programmatically.

A: 

Since that doesn't seem like a "function" that you could integrate I would using a numerical integration technique. I'm always partial to trapz which use the "trapezoidal rule" for numerical integration.

Something like:

area = trapz(data);

should be sufficient.

Hope that helps,

Will

JudoWill
Not as simple as that,the `data` is not readily available, only the `image` is given.
Is it at least a .fig file?
Doresoom
This is what I mean by `image`: http://internationalpropertiesregistry.com/Server/showFile.php?file=%2FUpload%2Fstatistics.gifc49ca28823a561a41d09ef9adbb5e0c5.gif
A: 

Since you only have the image available, I suggest you integrate by eye: count the number of whole squares underneath the red line.

For each square which the red line intersects, decide whether or not to include it in the count depending on how much lies below the line. Don't try to estimate how much of the square lies beneath the red line, at best that will give you an illusion of greater accuracy.

EDIT: I counted the green squares for you, the answer is 168 m.h

High Performance Mark
Good approximation. My code gave about 169 m*h. ;)
gnovice
+5  A: 

Here's an interesting solution :). Btw, it uses bwfill (similar to imfill) which needs some user interaction.

Code

%# Constants
gray_value_curve = 2;
gray_value_box = 3;
area_box_in_units = 10;

%# Read the image
I = imread('C:\p23\graph.gif');
%# Find the area of a unit block
figure(1);
imshow(I,[]);
[BS sq_elem] = bwfill;   
imshow(BS,[]);
%# Get the dimensions to make the estimate more accurate
X = zeros(size(BS));
X(sq_elem) = 1;
s = regionprops(X,'Area','BoundingBox');
block_area = s.Area + 2*(s.BoundingBox(3)-1) + 2*(s.BoundingBox(4)-1) + 4;

%#Find the area under the curve
I( ~(I == gray_value_curve | I == gray_value_box) ) = 0;
figure(2);
imshow(I,[]);
[BA area_curve_elem] = bwfill;
imshow(BA,[]);
%# Area under the curve
curve_area = numel(area_curve_elem);

%# Display the area in the required units
area = area_box_in_units*curve_area/block_area;
disp(area);

Output

113.5259

Figure 1 alt text Figure 2 alt text

Jacob
No, the desired solution should be fully automated, no user interaction will be available..
OK, so do you know where the bounding box will be?
Jacob
Sorry,which part exactly do you mean by bounding box?
The box which specifies the portion under the curve to be measured.
Jacob
@Jacob,no, nothing is known before hand.
OK, if you understood the code you'll realize that if you precompute the area of a unit block, then all you have to do is figure out a point in the bounding box and use that in `bwfill`
Jacob
I haven't understood it yet,can you explain why is that single point so important to calculate the area?
`bwfill` works by floodfilling. So it needs a starting point --- now it's provided by the user, and you'll have an autonomous program if you can find a point in the box.
Jacob
Can the cross point of x-axis and y-axis be used as a starting point?And can that point be retrieved programatically?
Yeah I suppose, it looks like the top-right corner of a box in the bottom-left corner of the image.
Jacob
@Jacob, can you update the code so that there will be no need to use `bwfill` or alike ?
No, I can only think of a floodfilling approach. I suggest you think of a method to find a point in that box --- I don't think it's very hard.
Jacob
Can you elaborate how you generated **Figure 1**? I only get this one, say, the color is reversed: http://internationalpropertiesregistry.com/Server/showFile.php?file=%2FUpload%2Funtitled.jpgb523c7595dd8e7514e1c6d51a83161a3.jpeg
That's how the GIF is read in MATLAB. Try reading it and displaying it as I did in the first part of the code.
Jacob
Oh I see it now, but strange, the graph generated by `imshow(I,[])` is totally distorted, it only becomes normal after `imshow(BS,[]);`, why?
`imshow(I,[low high])` displays the grayscale image `I`, specifying the display range for `I` in `[low high]`. If you use an empty matrix (`[]`) for `[low high]`, `imshow` uses `[min(I(:)) max(I(:))];` that is, the minimum value in I is displayed as black, and the maximum value is displayed as white --- http://www.mathworks.com/access/helpdesk/help/toolbox/images/imshow.html
Jacob
Thanks! Finally, my question was to calculate the entire area under the curve, but your solution only calculates half the area,right?
I was under the impression you wanted the area in the box --- if you want the area under the curve then just remove the box.
Jacob
And then floodfilling should be easier
Jacob
@Jacob,but how to remove the box?
+1  A: 

The difficulty with creating a fully-automated solution is that it would require you to hardcode into your solution certain assumptions about the input images you are going to process. If these assumptions don't hold for all the potential images you may come across, the fully-automated solution won't give trustworthy results, and trying to extend the fully-automated solution to handle all possible inputs will likely cause it to bloat into an incomprehensible and complicated mess of code.

When in doubt about the variability in features of your input images, a solution like Jacob's with some user interaction is generally best. If you can be certain that the features of your input images follow a strict set of rules, then an automated solution can be considered.

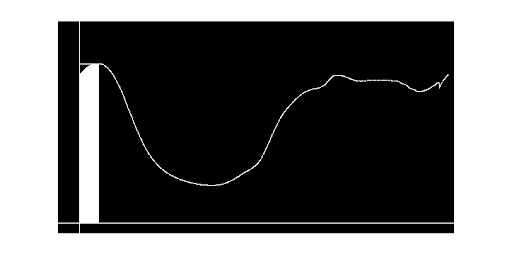
As an example, below is some automated code I wrote to approximate the area under the red curve in your graph. Since I used the above graph as a guide, there are a number of conditions that must be met for it to work:

  • The red pixels of the plotted line must be uniquely described in the image as containing green and blue color components equal to 0 and red color components equal to 1.
  • The green pixels of the grid lines must be uniquely described in the image as containing red and blue color components less than 1 and green color components equal to 1.
  • The blue pixels of the axes lines must be uniquely described in the image as containing red and green color components equal to 0 and blue color components equal to 1.
  • The grid and axis lines must always be exactly aligned in a horizontal or vertical direction.
  • The length of the grid lines must span well over half the width and height of the image.
  • The x axis must be the longest horizontal blue line in the image.
  • The grid lines must always be 1 pixel thick.

Subject to the above conditions on the input image, the following code can be used to approximate the area under the red curve without user input:

[img,map] = imread('original_chart.gif');  %# Read the indexed image
[r,c] = size(img);                         %# Get the image size

redIndex = find((map(:,1) == 1) & ...    %# Find the red index value
                (map(:,2) == 0) & ...
                (map(:,3) == 0))-1;
greenIndex = find((map(:,1) < 1) & ...   %# Find the green index value
                  (map(:,2) == 1) & ...
                  (map(:,3) < 1))-1;
blueIndex = find((map(:,1) == 0) & ...   %# Find the blue index value
                 (map(:,2) == 0) & ...
                 (map(:,3) == 1))-1;

redLine = (img == redIndex);      %# A binary image to locate the red line
greenLine = (img == greenIndex);  %# A binary image to locate the grid lines
blueLine = (img == blueIndex);    %# A binary image to locate the axes lines

w = mean(diff(find(sum(greenLine,1) > r/2)));  %# Compute unit square width
h = mean(diff(find(sum(greenLine,2) > c/2)));  %# Compute unit square height
squareArea = w*h;                              %# Compute unit square area

[maxValue,maxIndex] = max(redLine);          %# Find top edge of red line
x = find(maxValue > 0);                      %# Find x coordinates of red line
y = maxIndex(maxValue > 0);                  %# Find y coordinates of red line
[maxValue,maxIndex] = max(sum(blueLine,2));  %# Find row index of x axis
y = maxIndex-y;                              %# Zero the y coordinate
totalArea = trapz(x,y)/squareArea;           %# Compute the area under the curve

Which gives the following results:

squareArea = 460.6 square pixels
totalArea = 169.35 m*h


EXPLANATION:

I'll elaborate more about the steps involved in computing w:

  1. The binary image greenLine is summed along each column using the function SUM, giving a 1-by-c vector where each element is a count of how many grid line pixels are in each column of the image.
  2. The elements of this vector that are greater than r/2 (half the number of rows in the image) indicate columns of the image that contain a vertical grid line. The indices of these columns are found using the function FIND.
  3. The pairwise differences between these column indices are found using the function DIFF. This gives a vector containing the widths (in pixels) of the spaces between grid lines.
  4. Finally, the function MEAN is used to compute the mean width of the spaces between all the grid lines in the image.

When computing h, the only difference is that the sum is performed along each row and r/2 is replaced with c/2 (half the number of columns in the image).
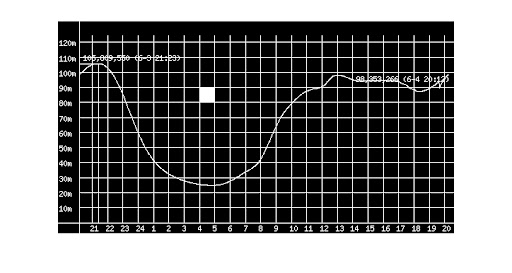
gnovice
Awesome!Thanks!
@gnovice, can you elaborate `mean(diff(find(sum(greenLine,1) > r/2)));` ? I can't understand what this statement does at all..
wamp
@wamp: I've added an explanation to my answer describing how `w` and `h` are computed.
gnovice
@gnovice, I just found that the image is only `560px` wide, but in `x/y` there are `756` values, many duplicates. Why is it like this and how does `trapz` do the job?
@user198729: Are you using the most recent version of the code? I had updated the code in my answer to address that very problem. The problem is that the red line is more than 1 pixel thick in spots. The old code used every pixel to perform the integration, while the new code uses only the pixels on the top edge. Using the newest code, you should get `504` values in `x` and `y`, and the total area only changes by `0.28`.
gnovice