Amro
2009-10-06 17:51:35
AMRO U DIDNT UNDERSTAND ME. i wanna plot the heart shape exactly in the picture. your plot contains many undesired lines which is SO DIFFERENT from the picture i showed. NICE TRY!!!
izzat
2009-10-19 09:49:56
A:
I think if you want to get the SAME type if lines as in the picture you made you CANNOT use a native matlab plotting tool. I think you will need to draw each line in the frame separately. But you know, that is not that hard. You could start with volume Amro gave yesterday and then do an interp along the plane defined by each "frame". Then plot the interps. That should only add a few lines of code. -Matt
MattZ
2009-10-08 12:51:05
+5
A:
Here's my best attempt at reproducing the entire figure:
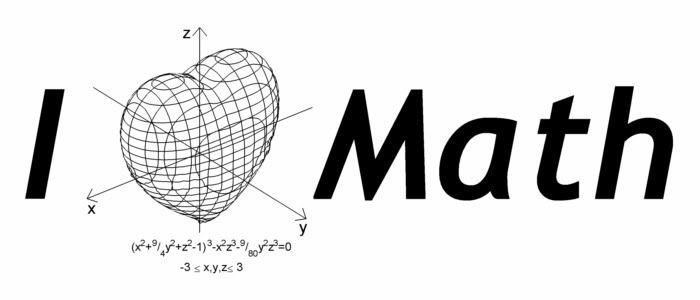
Generating the contoured heart mesh:
I used the CONTOURC function to generate a series of contours in the x-y, x-z, and y-z planes. Notice that in the image you want to reproduce, the mesh lines on the back-facing side of the heart are not rendered. The quickest and easiest way I could think of to reproduce that aspect of the plot was to use ISOSURFACE to render a white surface just beneath the inside surface of the mesh, blocking the view of the back side.
Here's the code for the function heart:
function heart

  % Initialize the volume data, figure, and axes:

  [X,Y,Z] = meshgrid(linspace(-3,3,101));
  F = -X.^2.*Z.^3-(9/80).*Y.^2.*Z.^3+(X.^2+(9/4).*Y.^2+Z.^2-1).^3;
  hFigure = figure('Position',[200 200 400 400],'Color','w');
  hAxes = axes('Parent',hFigure,'Units','pixels',...
               'Position',[1 1 400 400],'NextPlot','add',...
               'DataAspectRatio',[1 1 1],'Visible','off',...
               'CameraViewAngle',10,...
               'XLim',[32 70],'YLim',[39 63],'ZLim',[34 73]);
  view([-39 30]);

  % Create and plot contours in the y-z plane:

  for iX = [35 38 41 45 48 51 54 57 61 64 67]
    plane = reshape(F(:,iX,:),101,101);
    cData = contourc(plane,[0 0]);
    xData = iX.*ones(1,cData(2,1));
    plot3(hAxes,xData,cData(2,2:end),cData(1,2:end),'k');
  end

  % Create and plot contours in the x-z plane:

  for iY = [41 44 47 51 55 58 61]
    plane = reshape(F(iY,:,:),101,101);
    cData = contourc(plane,[0 0]);
    yData = iY.*ones(1,cData(2,1));
    plot3(hAxes,cData(2,2:end),yData,cData(1,2:end),'k');
  end

  % Create and plot contours in the x-y plane:

  for iZ = [36 38 40 42 44 46 48 50 52 54 56 58 60 62 64 66 69 71]
    plane = F(:,:,iZ);
    cData = contourc(plane,[0 0]);
    startIndex = 1;
    if size(cData,2) > (cData(2,1)+1)
      startIndex = cData(2,1)+2;
      zData = iZ.*ones(1,cData(2,1));
      plot3(hAxes,cData(1,2:(startIndex-1)),...
            cData(2,2:(startIndex-1)),zData,'k');
    end
    zData = iZ.*ones(1,cData(2,startIndex));
    plot3(hAxes,cData(1,(startIndex+1):end),...
          cData(2,(startIndex+1):end),zData,'k');
  end

  % Fill the inside of the mesh with an isosurface to
  % block rendering of the back side of the heart:

  p = patch(isosurface(F,-0.001));
  set(p,'FaceColor','w','EdgeColor','none');

end
Putting the figure together:
To reproduce the entire figure I first generated the heart mesh using the heart function above, then added the other elements around it. I also used a few submissions from The MathWorks File Exchange:
- arrow.m from Erik Johnson (to generate the arrows)
- myaa.m from Anders Brun (to create a nice anti-aliased final image)
Here's the code for the function I_Heart_Math (which generates the above figure):
function I_Heart_Math

  % Initialize heart plot and adjust figure and axes settings:

  heart;
  set(gcf,'Position',[200 200 700 300],'Name','Original image');
  offset = get(gca,'CameraPosition')-get(gca,'CameraTarget');
  offset = 35.*offset./norm(offset);
  set(gca,'Position',[65 -9 300 300],'CameraViewAngle',6,...
      'XLim',[21+offset(1) 70],'YLim',[16+offset(2) 63],...
      'ZLim',[32 81+offset(3)]);

  % Create the axes and labels, offsetting them in front of the
  % heart to give the appearance they are passing through it:

  arrowStarts = [81 51 51; 51 86 51; 51 51 32]+repmat(offset,3,1);
  arrowEnds = [21 51 51; 51 16 51; 51 51 81]+repmat(offset,3,1);
  arrow(arrowStarts,arrowEnds,5,40,40);
  text('Position',[22 52 48]+offset,'String','x','FontSize',12);
  text('Position',[50 17 49]+offset,'String','y','FontSize',12);
  text('Position',[46.5 51 81.5]+offset,'String','z','FontSize',12);

  % Create the equation text:

  text('Position',[51 47 28],'FontName','Bookman','FontSize',8,...
       'HorizontalAlignment','center',...
       'String',{'(x^2+^9/_4y^2+z^2-1)^3-x^2z^3-^9/_{80}y^2z^3=0'; ...
                 '-3 \leq x,y,z \leq 3'});

  % Create the large-type text:

  hI = text('Position',[4 52 69.5],'String','I',...
            'FontAngle','italic','FontName','Trebuchet MS',...
            'FontSize',116,'FontWeight','bold');
  hM = text('Position',[80.5 50 42.5],'String','Math',...
            'FontAngle','italic','FontName','Trebuchet MS',...
            'FontSize',116,'FontWeight','bold');

  % Create an anti-aliased version of the figure too (the larger
  % fonts need some adjustment to do this... not sure why):

  set(hI,'Position',[4 52 68],'FontSize',86);
  set(hM,'Position',[80.5 50 41],'FontSize',86);
  myaa;
  set(hI,'Position',[4 52 69.5],'FontSize',116);
  set(hM,'Position',[80.5 50 42.5],'FontSize',116);
  set(gcf,'Name','Anti-aliased image');

end
gnovice
2009-10-19 16:32:03
very nice. I was thinking of something of the sort (intersecting the volume with various perpendicular planes (slices), but this is far more better!). I also liked the way you handled hiding the back-face.
Amro
2009-10-19 20:13:23
@Amro: Thanks. My first idea to hide the back side of the mesh was to plot each closed contour as a filled patch. This looks fine with parallel planes, but with perpendicular planes that cross one another MATLAB seems to get confused about how to layer the patches and everything looks screwed up.
gnovice
2009-10-19 20:22:26