views:

59

answers:

4

I'm working on a web application, and it's getting to the point where I've got most of the necessary features and I'm starting to worry about execution speed. So I did some hunting around for information and I found a lot about reducing page load times by minifying CSS/JS, setting cache control headers, using separate domains for static files, compressing the output, and so on (as well as basic server-side techniques like memcached). But let's say I've already optimized the heck out of all that and I'm concerned with how long it actually takes my web app to generate a page, i.e. the pure server-side processing time with no cache hits. Obviously the tricks for bringing that time down will depend on the language and underlying libraries I'm using, but what's a reasonable number to aim for? For comparison, I'd be interested in real-world examples of processing times for apps built with existing frameworks, doing typical things like accessing a database and rendering templates.

I stuck in a little bit of code to measure the processing time (or at least the part of it that happens within the code I wrote) and I'm generally seeing values in the range 50-150ms, which seems pretty high. I'm interested to know how much I should focus on bringing that down, or whether my whole approach to this app is too slow and I should just give it up and try something simpler. (Based on the Net tab of Firebug, the parts of processing that I'm not measuring typically add less than 5ms, given that I'm testing with both client and server on the same computer.)

FYI I'm working in Python, using Werkzeug and SQLAlchemy/Elixir. I know those aren't the most efficient technologies out there but I'm really only concerned with being fast enough, not as fast as possible.

EDIT: Just to clarify, the 50-150ms I quoted above is pure server-side processing time, just for the HTML page itself. The actual time it takes for the page to load, as seen by the user, is at least 200ms higher (so, 250-350ms total) because of the access times for CSS/JS/images (although I know that can be improved with proper use of caching and Expires headers, sprites, etc. which is something I will do in the near future). Network latency will add even more time on top of that, so we're probably talking about 500ms for the total client load time.

Better yet, here's a screenshot from the Net tab of Firebug for a typical example: Loading times from Firebug 
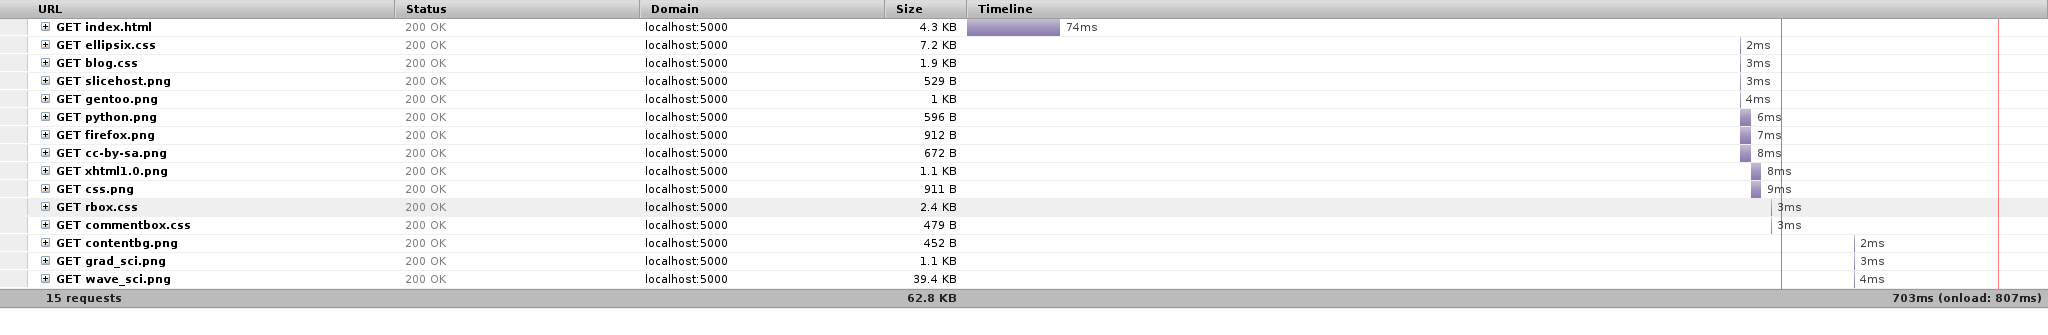
It's the 74ms at the top that I'm asking about.

A: 

50-150ms for page load time is fine - you do not need to optimize further at this point.

The fact is, so long as your pages are loading within a second, you are OK.

See this article, which discusses the effects of load times for conversion (100ms increase = 1% for amazon).

Oded
+1  A: 

I looked at some old JMeter results from when I wrote and ran a suite of performance tests against a web service. I'll attach some of them below, it's not apples-to-apples of course but at least another data point.

Times are in milliseconds. Location Req and Map Req had inherent delays of 15000 and 3000 milliseconds, respectively. Invite included a quick call to a mobile carrier's ldap server. Others were pretty standard, mainly database read/writes.

sampler_label    count    average    min    max
Data Blurp       2750     185        30     2528 
UserAuth         2750     255        41     2025
Get User Acc     820      148        29     2627
Update User Acc  4        243        41     2312
List Invitations 9630     345        47     3966
Invite           2750     591        102    4095
ListBuddies      5500     344        52     3901
Block Buddy      403      419        79     1835
Accept invite    2065     517        94     3043
Remove Buddy     296      411        83     1942
Location Req     2749     16963      15369  20517
Map Req          2747     3397       3116   5926

This software ran on a dedicated, decent virtual machine, tuned the same way production VMs were. The max results were slow, my goal was to find the number of concurrent users we could support so I was pushing it.

I think your numbers are absolutely ok. With regards to all the other stuff that makes websites seem slow, if you haven't, take a look at YSlow. It integrates nicely with Firebug and provides great information about how to make pages load faster.

Lauri Lehtinen
+1 for the data, that's the kind of thing I was interested in. (I do already have YSlow, by the way, but thanks for the tip)
David Zaslavsky
+4  A: 

IMHO, 50-150 ms on client side on server side is fine in most circumstances. When I measure the speed of some very known websites, I rarely see something as fast. Most of the times, it is about 250 ms, often higher.

Now, I want to underline three points.

  1. Everything depends on the context. A home page or a page which will be accessed very frequently will suck a lot if it takes seconds to load. On the other hand, some rarely used parts of the website can take up to one second if optimizations are to expensive.

  2. The major concern of the users is to accomplish what they want quickly. It's not about the time taken to access a single page, but rather the time to access information or to accomplish a goal. That means that it's better to have one page taking 250 ms than requiring the user to visit three pages one after another to do the same thing, each one taking 150 ms to load.

  3. Be aware of the perceived load time. For example, there is an interesting trick used on Stack Overflow website. When doing something which is based on AJAX, like up/down-voting, first you see the effect, then the request is made to the server. For example, try to up-vote your own message. It will show you that the message is up-voted (the arrow will become orange), then, 200 ms later, the arrow will become gray and an error box will be displayed. So in the case of an up-vote, the perceived load time (arrow becomes orange) is 1 ms, when the real load time spent doing the request is 100 ms.

EDIT: 200 ms is fine too. 500 ms will probably hurt a little if the page is accessed frequently or if the user expects the page to be fast (for example, AJAX requests are expected to be fast). By the way, I see on the screenshot that you are using several CSS files and ten PNG images. By combining CSS into one file and using CSS sprites, you can probably reduce the perceived load time, especially when dealing with network latency.

MainMa
@MainMa: Good points. What you're saying about sprites and combining CSS files is certainly on my "to do" list, but that's not really what I meant my question to focus on.
David Zaslavsky
@David Zaslavsky: I know. It was just a thing I noticed. That's why I placed this at the end of my answer. So if you want, my answer is: 1. Your current page processing time is quite good and there is no global and unique "appropriate page processing time". 2. End-users would probably have other concerns (time to accomplish a goal + perceived time).
MainMa
@MainMa: Understood ;-) I guess extra advice never hurts - it certainly doesn't diminish the quality of your answer.
David Zaslavsky
+2  A: 

Jakob Nielsen, a well known speaker on usability posted an article [1] on this a few days back. He suggests that under 1 second is deal, under 100ms is perfect as it interrupts the user flow a bit more.

As other users have pointed out it depends on the context of that page. If someone is uploading a file they expect a delay. If they're logging in and it takes ten seconds they can start to get frustrated.

[1] http://www.useit.com/alertbox/response-times.html

tooba