i have a 2D binary matrix that i want to convert as a plot of black and white matrix.. please how this can be done ? can you please provide me with a code? let say i have 4*2 matrix it's entry as follow: 1 1 0 1 0 0 1 0 1 1 0 1 1 0 0 0 how this can be converted to black white matrix? some of my input binary matrices are of size 100*9, so it will be possible to draw that using MatLab as black white instead of ones zeros? Many thanks...
A:
I'm not sure if I got your question right, but you may try the image function, like this:
A = [ 1 1 0; 1 0 1; 1 1 1 ];
colormap([0 0 0; 1 1 1 ]);
image(A .* 255);
WebMonster
2010-07-19 12:00:23
thank you very much. this was helpful but not what as exactly as i need, i need something like this (please find the URL):http://www.mathworks.com/access/helpdesk/help/techdoc/ref/pcolor1.gif
sahamdan
2010-07-19 13:14:45
+1
A:
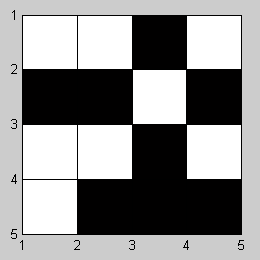
If you want to make a crossword-type plot as shown in your link (with grid lines and black and white squares) you can use the IMAGESC function, a gray colormap, and modify the axes properties like so:
mat = [1 1 0 1; 0 0 1 0; 1 1 0 1; 1 0 0 0];  %# Your sample matrix
[r,c] = size(mat);                           %# Get the matrix size
imagesc((1:c)+0.5,(1:r)+0.5,mat);            %# Plot the image
colormap(gray);                              %# Use a gray colormap
axis equal                                   %# Make axes grid sizes equal
set(gca,'XTick',1:(c+1),'YTick',1:(r+1),...  %# Change some axes properties
        'XLim',[1 c+1],'YLim',[1 r+1],...
        'GridLineStyle','-','XGrid','on','YGrid','on');
And here's the image you should get:
gnovice
2010-07-19 15:04:03