views:

544

answers:

1

I've got a 2-D histogram (the plot is 3D - several histograms graphed side by side) that I've generated with the bar3 plot command. However, all the zero values show up as flat squares in the x-y plane. Is there a way I can prevent MATLAB from displaying the values? I already tried replacing all zeros with NaNs, but it didn't change anything about the plot. Here's the code I've been experimenting with:

x1=normrnd(50,15,100,1); %generate random data to test code
x2=normrnd(40,13,100,1);
x3=normrnd(65,12,100,1);

low=min([x1;x2;x3]);
high=max([x1;x2;x3]);
y=linspace(low,high,(high-low)/4); %establish consistent bins for histogram
z1=hist(x1,y);
z2=hist(x2,y);
z3=hist(x3,y);
z=[z1;z2;z3]';
bar3(z)

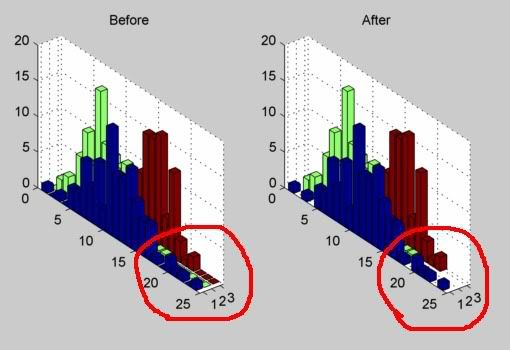
As you can see, there are quite a few zero values on the plot. Closing the figure and re-plotting after replacing zeros with NaNs seems to change nothing:

close
z(z==0)=NaN;
bar3(z)
+6  A: 

One solution is to modify the patch objects created by BAR3. First, you have to get the handles returned from BAR3:

h = bar3(z);

In your case, h will be a 3-element vector of handles, one for each set of colored bars. The following code should then make the bins with counts of zero invisible:

for i = 1:numel(h)
  index = logical(kron(z(:,i) == 0,ones(6,1)));
  zData = get(h(i),'ZData');
  zData(index,:) = nan;
  set(h(i),'ZData',zData);
end

And here's an illustration (with obligatory free-hand circles):

alt text

How it works...

If your vector of bin counts is N-by-1, then BAR3 will plot 6*N rectangular patches (i.e. the 6 faces of a cuboid for each bin). The 'ZData' property for each set of patch objects in h will therefore be (6*N)-by-4, since there are 4 corners for each rectangular face. Each cluster of 6 rows of the 'ZData' property is therefore a set of z-coordinates for the 6 faces of one bin.

The above code first creates a logical vector with ones everywhere the bin count equals 0, then replicates each element of this vector 6 times using the KRON function. This becomes an index for the rows of the 'ZData' property, and this index is used to set the z-coordinates to NaN for the patches of empty bins. This will cause the patches to not be rendered.

gnovice
I got the idea to modify the object properties after I asked the question, but I didn't know where to start. Your code works great - I put it in an m-file bar3nonzero, and now I've got a hassle free way to produce plots.
Doresoom
@gnovice: +1 ..yet again you managed to find a good use for the kron function :)
Amro

related questions