views:

270

answers:

5

Any one know of a tutorial or library or something that i could use to help me accomplish rendering a X-Y GRAPH for performance data or just data in general.

My goal is to have a final result looking something similar to

alt text

This Chart rendered by RRD.

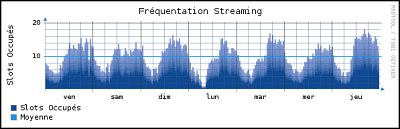
So just to clarify i just want to render these type of images i don't want rich server controls as they are over kill in my eyes. DevExpress,ComponentOne,Tel..,MSChart,FusionCharts,Jplot,dygraph,Ifragestics,DotNetcharting,AMcharts are no goods...

A: 

DevExpress Telerik Obout ComponentOne

FerretallicA
No, i have tried these as well please take alook at the picture.
BlackTea
Have you actually tried DevExpress charts?http://www.devexpress.com/Products/NET/Controls/Charting/screenshot_gallery.xmlI don't see why their 2D area graph wouldn't do what you're after, or a high-density 2D stacked bar graph with
FerretallicA
+3  A: 

Have a look at ZedGraph (open source, licensed under LGPL).

Joviee
A: 

Fusion charts

They also have a free edition.

this. __curious_geek
+5  A: 

Microsoft provides a really good, free charting library for ASP.NET and Winforms. http://www.microsoft.com/downloads/details.aspx?FamilyId=130F7986-BF49-4FE5-9CA8-910AE6EA442C&displaylang=en

See it here: http://code.msdn.microsoft.com/mschart

Doobi
I will second this. Once you learn how to bind data fast, it works great.
leppie
+2  A: 

There is a RRD project called NHawk (C# RRDTool Library for .Net and Mono) which is an initiative to provide a thin, complete RRDtool provider for the .Net and Mono framework. More details are available at "C# Hooks For RRDTool".

Space