views:

432

answers:

1

So I've read the two related questions for calculating a trend line for a graph, but I'm still lost.

I have an array of xy coordinates, and I want to come up with another array of xy coordinates (can be fewer coordinates) that represent a logarithmic trend line using PHP.

I'm passing these arrays to javascript to plot graphs on the client side.

+7  A: 

Logarithmic Least Squares

Since we can convert a logarithmic function into a line by taking the log of the x values, we can perform a linear least squares curve fitting. In fact, the work has been done for us and a solution is presented at Math World.

In brief, we're given $X and $Y values that are from a distribution like y = a + b * log(x). The least squares method will give some values aFit and bFit that minimize the distance from the parametric curve to the data points given.

Here is an example implementation in PHP:

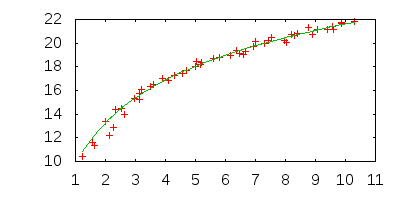
First I'll generate some random data with known underlying distribution given by $a and $b

  // True parameter valaues
  $a = 10;
  $b = 5;

  // Range of x values to generate
  $x_min = 1;
  $x_max = 10;
  $nPoints = 50;

  // Generate some random points on y = a * log(x) + b
  $X = array();
  $Y = array();
  for($p = 0; $p < $nPoints; $p++){
    $x = $p / $nPoints * ($x_max - $x_min) + $x_min;
    $y = $a + $b * log($x);

    $X[] = $x + rand(0, 200) / ($nPoints * $x_max);
    $Y[] = $y + rand(0, 200) / ($nPoints * $x_max);

  }

Now, here's how to use the equations given to estimate $a and $b.

  // Now convert to log-scale for X
  $logX = array_map('log', $X);

  // Now estimate $a and $b using equations from Math World
  $n = count($X);
  $square = create_function('$x', 'return pow($x,2);');
  $x_squared = array_sum(array_map($square, $logX));
  $y_squared = array_sum(array_map($square, $Y));
  $xy = array_sum(array_map(create_function('$x,$y', 'return $x*$y;'), $logX, $Y));

  $bFit = ($n * $xy - array_sum($Y) * array_sum($logX)) /
          ($n * $x_squared - pow(array_sum($logX), 2));

  $aFit = (array_sum($Y) - $bFit * array_sum($logX)) / $n;

You may then generate points for your Javascript as densely as you like:

  $Yfit = array();
  foreach($X as $x) {
    $Yfit[] = $aFit + $bFit * log($x);
  }

In this case, the code estimates bFit = 5.17 and aFit = 9.7, which is quite close for only 50 data points.

alt text

For the example data given in the comment below, a logarithmic function does not fit well.

alt text

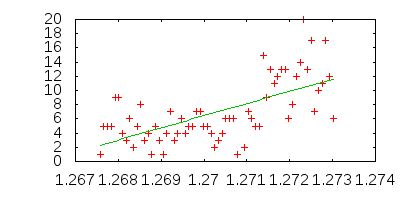
The least squares solution is y = -514.734835478 + 2180.51562281 * log(x) which is essentially a line in this domain.

Geoff
Alright, I'm off to the google races. I'll get back to you with what I find.
Stephen
In theory, your updated comment makes sense. In practice? I'm a dunce at math. I looked at the two equations you mentioned and almost fainted.
Stephen
Okay. Well, I did some more research into the problem and have written and tested some code that does this for you, and re-written my answer. Let me know if you have any questions.
Geoff
That's awesome. This is exactly what I was looking for. I'm going to break down your code and try to learn what exactly is going on. I appreciate it.
Stephen
I tried to implement your solution, but my y values are coming out way wrong the range of y values in my array of points is anywhere from 0 to 100. The trendline I'm coming up with has y values in the negative thousands. Here's the code:
Stephen
I've updated the question with my code.
Stephen
Stephen, maybe you can use `pastebin` to share your data? Is it possible it's not really a logarithmic distribution?
Geoff
Sure thing. Here is the array in javascript after I've pulled it from the database view PHP: http://pastebin.com/JTLQdRhg
Stephen
These data look more like an exponential distribution.http://mathworld.wolfram.com/LeastSquaresFittingExponential.html
Geoff
I didn't mention it because I didn't think it would matter, but: The x values are numeric representations of dates.
Stephen
Sorry! I had `aFit` and `bFit` confused! I have updated the post to reflect this.
Geoff
YES! As soon as I swapped the aFit and bFit everything works perfectly now. I've been struggling with this for days. I really appreciate it. And bonus: I studied those equations in detail, so I've learned a lot from this hurdle.
Stephen
Great. Will you either correct, or remove (probably better) the code you put in your updated question to avoid any confusion a future reader may have?
Geoff
Sure Thing. Done.
Stephen