views:

246

answers:

7

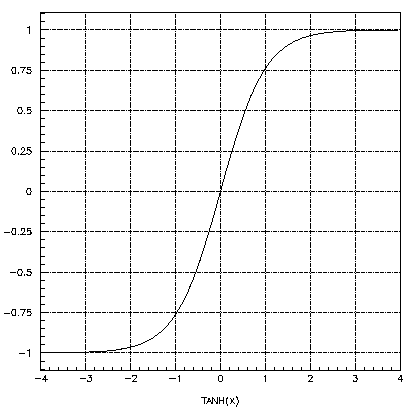
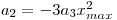
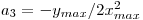
And can you give me an example of an algorithm? alt text

EDIT: And then how would I calculate the math using Javascript? Can someone add that? Sorry to not include that context originally..

NOTE: I am using 'flot' to graph it and the input for flot is a javascript array like this:

[[x,y],[x,y],[x,y]...]

So given the values that change the curve I output all the points to an array with a loop and spit it out to flot to graph.

+1  A: 

A Bézier curve? The corresponding algorithm to draw it would be de Casteljau's algorithm.

Joey
+3  A: 

If you want a single, analytic function, then ArcTangent and Hyperbolic Tangent both have that shape, you just need to shift it over a bit. If you want it to only start at the origin and be flat, look at Exp[-1/x^n], for n>=1. This produces a curve that is exceedingly flat at the origin.

Victor Liu
Beat me to 1 ;).
del.ave
updated the question to show programming relation, any idea how to put this algorithm in javascript?
shogun
+2  A: 

Try to lookup sigmoid function, it looks a lot like it.

alt text

Jesper Madsen
tinyurl.com is your friend.
cHao
needs some formatting I think
Default
Please check your URLs and use link markup.
Justin
It doesn't just look like a sigmoid function, it *is* a sigmoid function. Which, exactly, I cannot say. Btw: Your "URL" is invalid.
Andreas Rejbrand
@Andreas, your comment makes me think were you able to figure out how to view this... ??
shogun
@Ryan: The mess in Jesper's message do include a valid link: http://ulcar.uml.edu/~iag/CS/Sigmoid-function.GIF
Andreas Rejbrand
when you write an answer, you have a real-time preview just below the input window
mykhal
oh there we go now I see it, thanks Andreas
shogun
fixed the link for you Jesper, and +1 after the repairs to cancel the -1 since this actually is one that could possibly work for me, thanks
shogun
mykhal: The instant preview worked, while it didn't show up here – this is the perpetual problem of implementations with different bugs and behavior; there's a lot more different between the preview and the final result here. Andreas: The URI Ryan gave was a valid one – that doesn't stop a faulty URI parser to mess things up.
Joey
The reason the image didn't show up in the first place is that you need 15 rep to be able to post images. Can't find the reference right now though.
ChrisF
+1  A: 

Might I sugggest:

  • The error function (erf(x) in C)
  • The normal cumulative distribution function (0.5 * erfc(-x/sqrt(2)))
  • The logistic function (1.0 / (1.0 + exp(-x)))
  • Any other sigmoid function
Thom Smith
+1 for the `sigmoid` keyword (-> http://en.wikipedia.org/wiki/Sigmoid_function)
mykhal
A: 

What you are looking for is called Sigmoid function. You can look it up in Wikipedia. Some function that are used for this are error function or logistic function. These are most commonly use for neural networks.

dlb
+3  A: 
Andreas Rejbrand
thanks but my implementation isn't working as I'd expect, for every X value I add it returns the same Y value (a straight line is coming out)
shogun
@Ryan: That might be because you forget to update exp2x each time. The expression is really `y = (Math.exp(2*x)- 1) / (Math.exp(2*x)+ 1`. I just optimized a bit by reducing one of the identical calls to the slow `exp` function.
Andreas Rejbrand
see added details, +1 for your help so far, one step closer to the answer vote :)
shogun
The tanh function makes a good sigmoid shape on x \in [-3, 3], say. Very close to x ~ 0, tanh does look like the straight line y = x. See this picture: http://privat.rejbrand.se/tanh.png
Andreas Rejbrand
see update again, I spit out some values
shogun
OK cool I see your update for shifting the curve, still working on getting it to draw right, and obviously give me the values I want (Y axis represents a percentage in my use case so must be between 0-100)
shogun
Yes, I see the problem. Well, as I said, the graph y = tanh(x) has the desired shape if you look at x between -3 and 3 (say). For x > 3, the graph becomes increasingly linear (and planar). So you are plotting the function in the wrong domain! Plot it in x = -3 to x = +3 instead. Or, shift the graph.
Andreas Rejbrand
Thanks Andreas, can you show me how to shift it in javascript too? I think I am doing it wrong: return 1 + (Math.pow(exp2x, ((2*x) - 6)) - 1) / (Math.pow(exp2x, ((2*x) - 6)) +1);
shogun
I see your update for the 0-100 range THANKS, now I just gotta get it into my JS properly, I've awarded you the answer of course :)
shogun
@Rytan: There was a slight typo. We want to divide by 10, not by 100... Sorry...
Andreas Rejbrand
got it thanks, I also added the JS tanh function implementation under your most recent curve
shogun
A: 

All this is wonderful, but there's another thought:

Assume a third order polynomial:

alt text

You have four boundary conditions:

alt text alt text alt text alt text

If you substitute these into the equation and work out the algebra you get the following result:

alt text

where

alt text

and

alt text

It may not be exact, but you can easily approximate it based on the values you know: alt text

duffymo